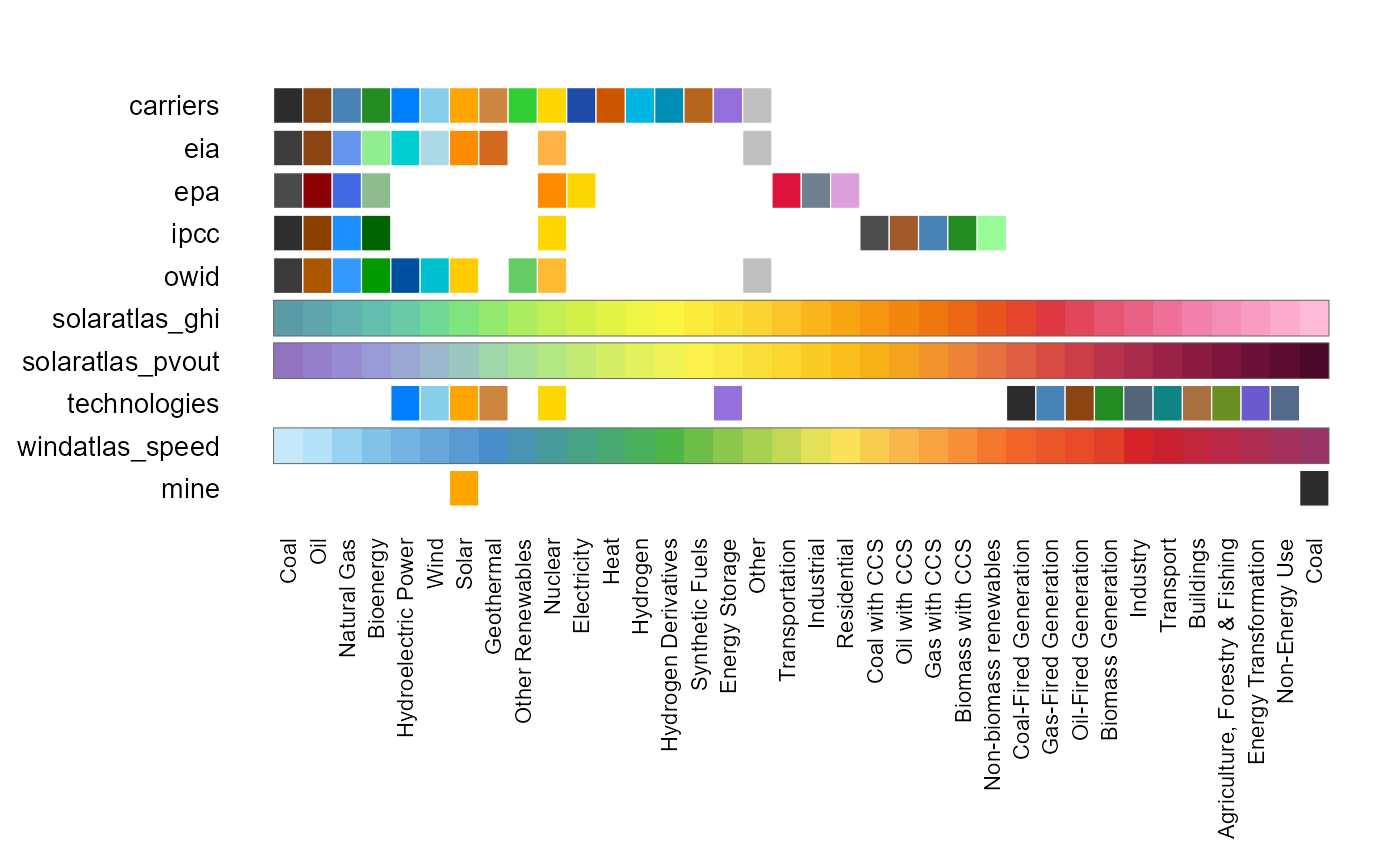
Draws a palette so you can look at it. Given several palette names it draws them as aligned rows instead, one row per palette and one column per entry, which is the quickest way to see how two published colour schemes differ.
Usage
energypal_show(
  palette = NULL,
  n = NULL,
  file = NULL,
  label_style = c("default", "id", "short", "long"),
  include_groups = FALSE,
  include_subtypes = FALSE,
  show_hex = TRUE
)
Arguments
- palette
Palette name, or a character vector of names to compare. Defaults to the
energypal.paletteoption, or"carriers". Passenergypal_info()$nameto see everything at once.- n
Number of colours to show from each palette.
NULLshows all.- file
Path to a palette file, taking precedence over
palette. Only meaningful for a single palette.- label_style
How to label entries:
"default","id","short"or"long". Seeenergypal().- include_groups, include_subtypes
Passed to
energypal(); bothFALSEby default, matching the plotting palette.- show_hex
Logical; show the hex code alongside the name in the single-palette view (default
TRUE).
Value
Invisibly, the palette(s) drawn: a named colour vector for a single palette, or a named list of them.
See also
energypal() for the colours themselves, energypal_info() for
the list of palettes.
Examples
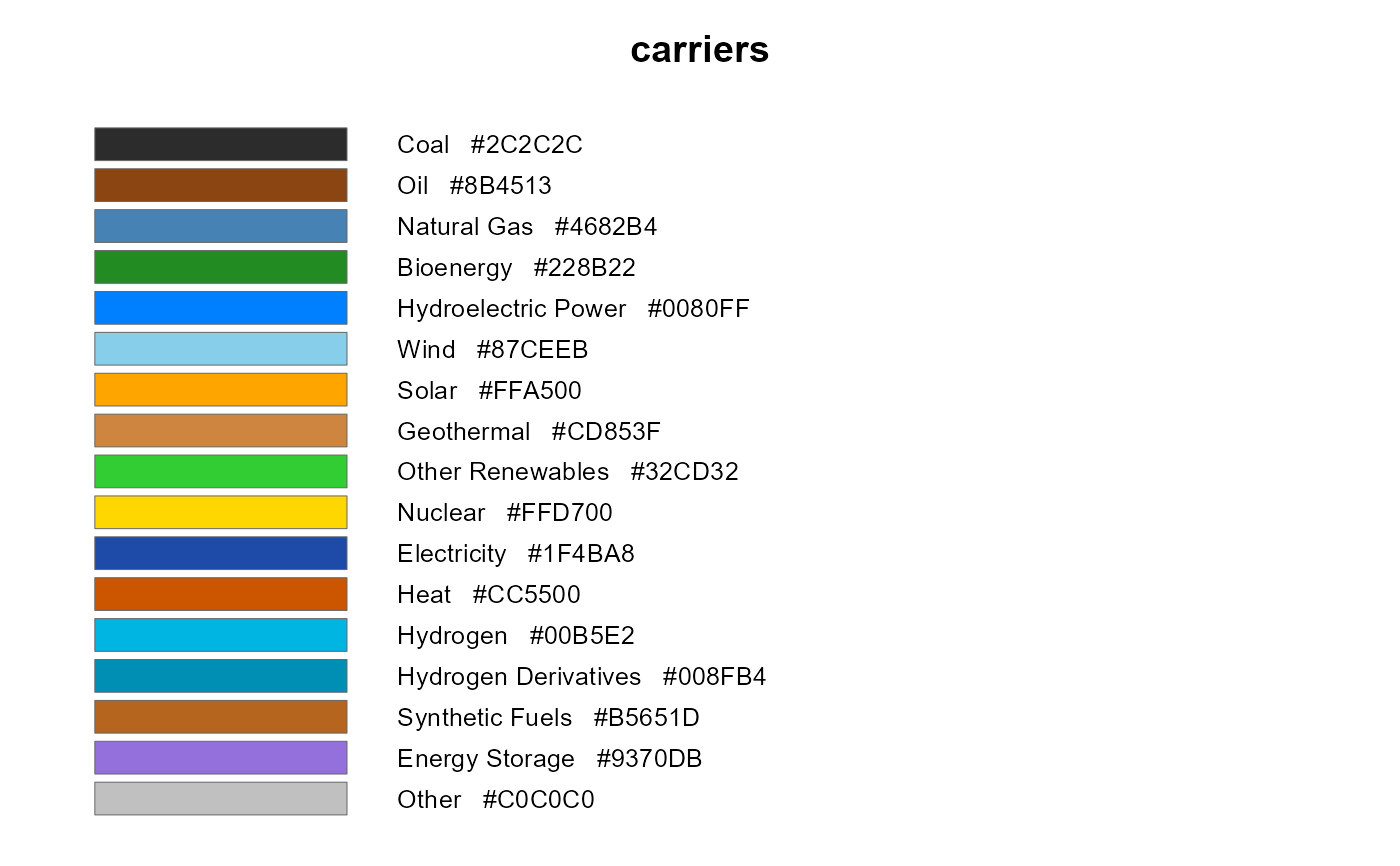
energypal_show("carriers")
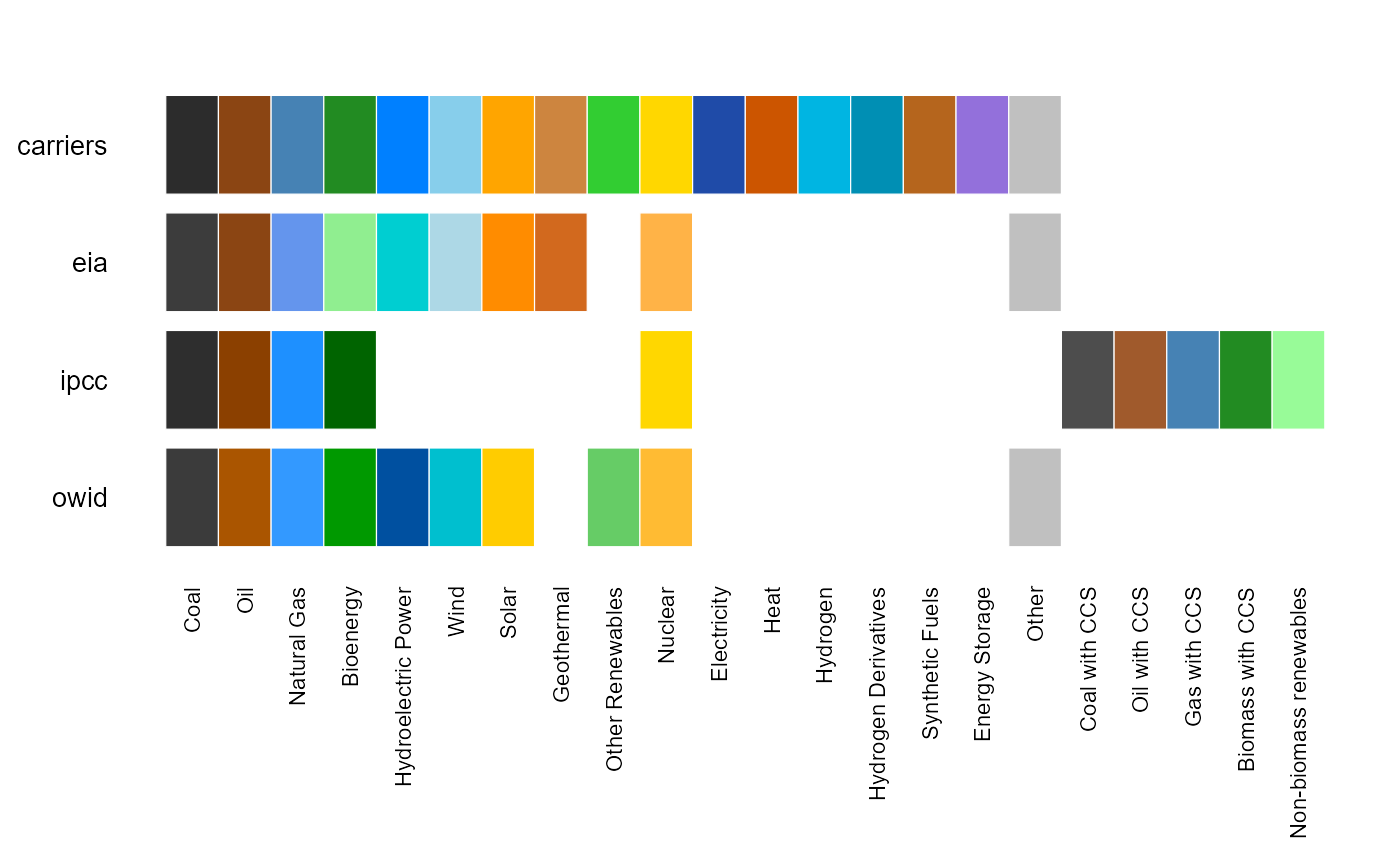
 # Compare published schemes
energypal_show(c("carriers", "eia", "ipcc", "owid"))
# Compare published schemes
energypal_show(c("carriers", "eia", "ipcc", "owid"))
 # Everything the package ships
energypal_show(energypal_info()$name)
# Everything the package ships
energypal_show(energypal_info()$name)