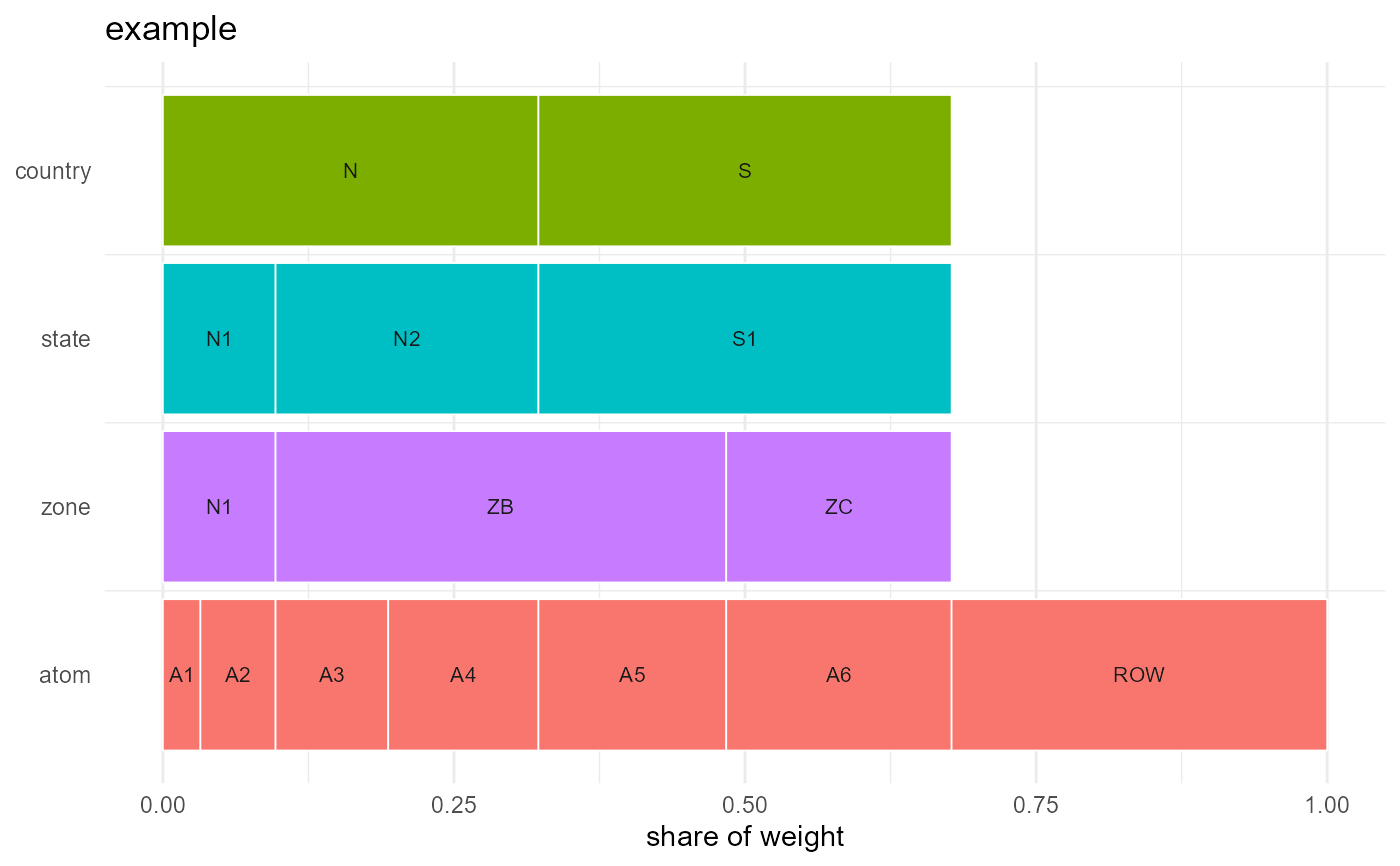
Draws the hierarchy as an icicle: one row per level, coarsest at the top, each region's width proportional to its share of the weight.
Usage
geo_autoplot(
  object,
  weight = NULL,
  fill = c("level", "region"),
  label = TRUE,
  ...
)

autoplot.Geoscale(x, ...)Details
This is the structure plot — it shows the Geoscale itself and needs no
geometry. For a map of values over regions, see geo_plot().
Also registered as an autoplot() method, so ggplot2::autoplot(gs) works
when ggplot2 is installed.
Examples
if (requireNamespace("ggplot2", quietly = TRUE)) {
  geo_autoplot(geoscale_example())
}