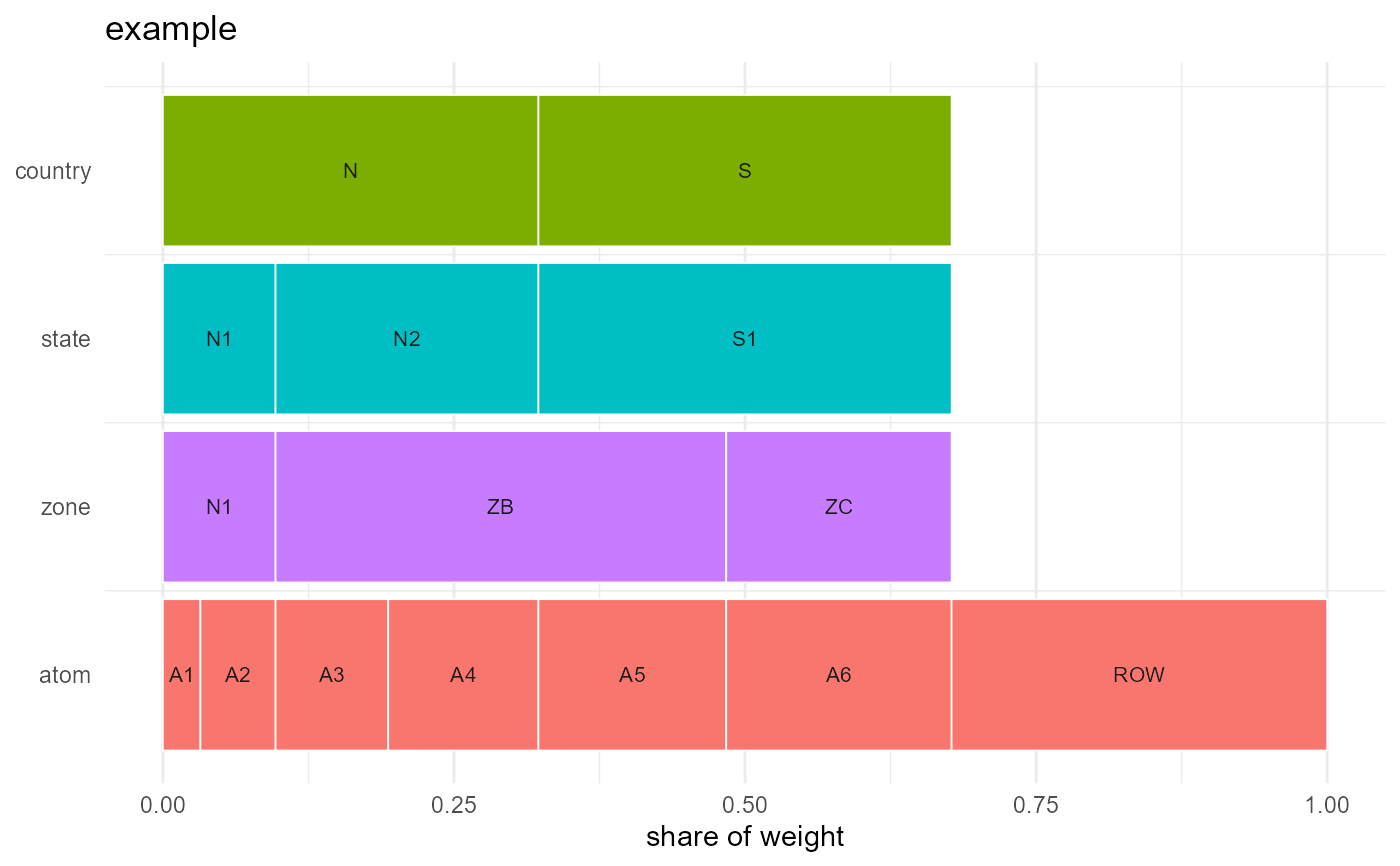
Draws the hierarchy as an icicle: one row per geoframe, coarsest at the top, each region's width proportional to its share of the weight.
Usage
geoscale_autoplot(
  x,
  type = c("icicle", "stack"),
  weight = NULL,
  fill = c("geoframe", "region"),
  label = TRUE,
  view = NULL,
  angle = NULL,
  ratio = NULL,
  shear = 0.45,
  depth = 0.55,
  gap = NULL,
  rotate = 0,
  direction = c("up", "down"),
  precision = 0,
  data = NULL,
  z = NULL,
  rule = "weighted_mean",
  labels = NULL,
  palette = "H",
  colour = "grey35",
  linewidth = 0.2,
  frame = NULL,
  frame_fill = NA,
  connectors = FALSE,
  ...
)

# S3 method for class 'Geoscale'
autoplot(x, ...)
Arguments
- x
A
Geoscale.- type
"icicle"(default) or"stack"— the axonometric stacked-maps view: one sheared map plane per geoframe, coarsest on top, the same atoms dissolved at each resolution. Requires attached geometry (and the sf package);weight/fill/labelapply to the icicle only.- weight
Weight column determining widths.
NULLuses the default.- fill
What to colour by:
"geoframe"or"region".- label
Draw region codes on the rectangles.
- view
type = "stack"only: a predefined point of view –"oblique"(the shear/depth default),"top-down","cavalier","cabinet","military","isometric","dimetric","trimetric", or"perspective"(receding planes shrink).- angle, ratio
type = "stack"only: oblique view by angle (degrees of the receding axis) and foreshortening ratio –e2 = ratio * (cos(angle), sin(angle)). Overridden byview.- shear, depth, gap
type = "stack"only: raw receding-axis components (e2 = (shear, depth); used when neitherviewnorangle/ratiois given) and the vertical spacing between planes.gap = NULL(default) spaces planes almost touching, with a slight overlap.- rotate
type = "stack"only: in-plane rotation of each plane (degrees, counter-clockwise) – point North where you want it.- direction
type = "stack"only:"up"(default) stacks the coarsest geoframe on top;"down"puts it at the bottom.- precision
type = "stack"only: GEOS precision for the dissolve, forwarded togeoscale_geometry(). Default0= off.- data, z
Colour the figure by a value instead of by structure: works for BOTH types – the icicle fills each band's rectangles (overriding
fill), the stack fills each plane.datamust carry the atom geoframe as a key column plus the value column named byz; every coarser geoframe gets the value recast up withrecast_geoscale()(seerule), so the whole figure shares one continuous fill scale (legend title vialabs(fill = )).- rule
With
data: aggregation rule used to recastzfrom the atoms to each coarser geoframe ("weighted_mean"default; seerecast_geoscale()). The icicleweightargument doubles as the weight column for"weighted_mean"(NULL= the geoscale's default weight)."share"colours every plane by each region's share within the plane above it (the coarsest plane by its share of the grand total), so the whole figure reads on one 0..1 scale;weightplays no part.- labels
type = "stack"only: character vector of geoframes whose regions get their display names (the@meta$labelscolumn, falling back to codes) drawn on the plane.NULL(default) = none.- palette
Viridis palette option (
"A".."H") for the plane fill and for both types'datafills. Default"H".NULLadds no fill scale at all, so you can supply your own – e.g.energypal::scale_fill_energy_b()for the Global Wind Atlas colours on their absolute breaks. Withrule = "share"the fill is a fixed linear 0..1 scale, with"logshare"a fixed log10 percent scale (0.01%..100%) – either way any two share figures are colour-comparable.- colour, linewidth
type = "stack"only: region border colour and width, recycled across the planes (socolour = c("white", "grey40", "white")styles one plane per entry). Defaults"grey35"and0.2– ggplot2's own sf polygon border.- frame
type = "stack"only: draw each plane's outline (the footprint box run through the same projection) as a guide – curved shapes are much easier to read in oblique views with the plane edges visible.TRUEuses"grey80", a colour string uses that colour,NULL(default) draws no frames.- frame_fill
type = "stack"only: fill for the plane sheets. Best mostly transparent, e.g.frame_fill = ggplot2::alpha("grey60", 0.12)– the panes then read as glass sheets and slightly dim what lies beneath them. Setting a fill draws the frames even withoutframe;NA(default) = no fill.- connectors
type = "stack"only: draw dashed lines joining the corresponding frame corners of adjacent planes – the vertical guides of the stack.TRUEuses the frame colour, a colour string picks its own; defaultFALSE.- ...
Unused.
Details
This is the structure plot — it shows the Geoscale itself and needs no
geometry. For a map of values over regions, see geoscale_plot().
Also registered as an autoplot() method, so ggplot2::autoplot(gs) works
when ggplot2 is installed.
Examples
if (requireNamespace("ggplot2", quietly = TRUE)) {
  geoscale_autoplot(geoscale_example())
}